Sveltos Tiers: Day-2 Ops Targeted Updates
Introduction
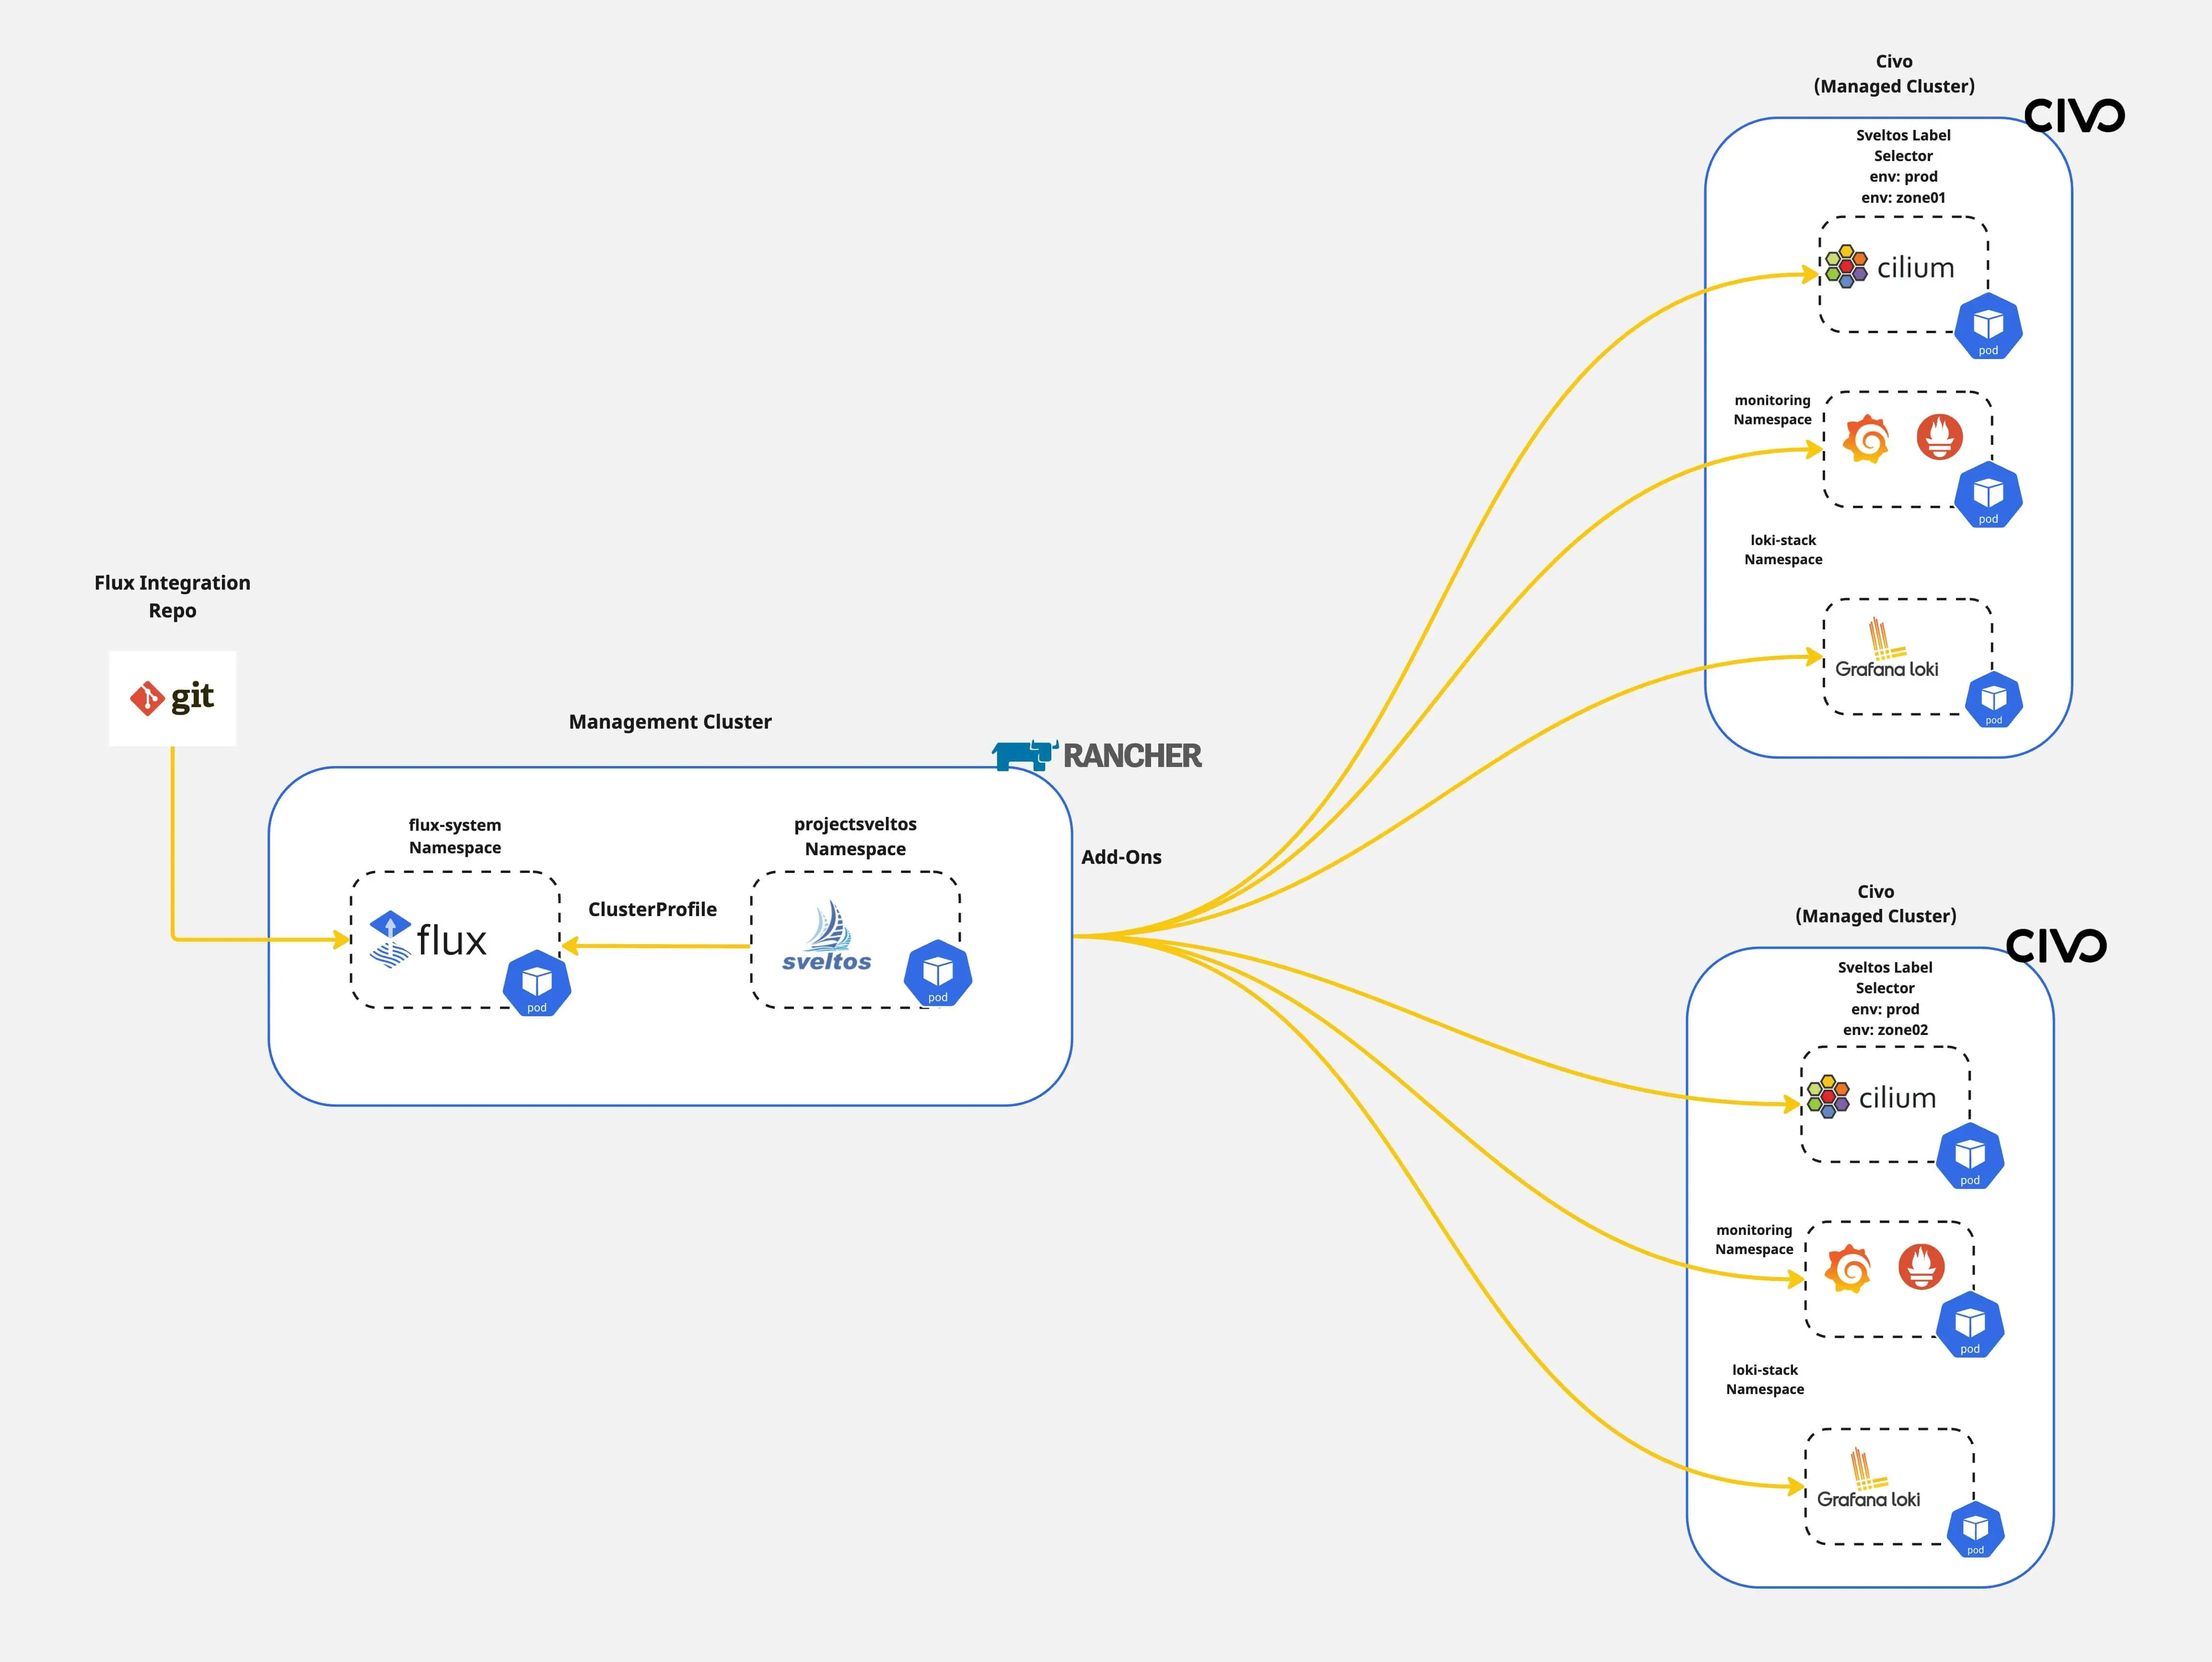
In previous posts, we outlined how Sveltos allows Platform and tenant administrators to streamline Kubernetes applications and add-on deployments to a fleet of clusters. In today's blog post, we will take a step further and demonstrate how easy it is to target and update a subset of resources targeted by multiple configurations. By multiple configurations, we refer to the Sveltos ClusterProfile or Profile Custom Resource Definitions (CRDs). The demonstration focuses on day-2 operations as we provide a way to update and/or remove resources without affecting production operations.
This functionality is called tiers. Sveltos tiers provide a solution for managing the deployment priority when resources are targeted by multiple configurations. They fit into current ClusterProfile/Profile definitions. They also set the deployment order and easily override behaviour.
Today, we will cover the case of updating the Cilium CNI in a subnet of clusters with the label set to tier:zone2 without affecting the monitoring capabilities defined in the same ClusterProfile/Profile.
Lab Setup
+-----------------+-------------------+--------------------------+
|   Cluster Name  |        Type       |         Version          |
+-----------------+-------------------+--------------------------+
|   mgmt          | Mgmt Cluster      |      v1.28.9+rke2r1      |
|  prod-zone01    | Managed Cluster   |      v1.29.2+k3s1        |
|  prod-zone02    | Managed Cluster   |      v1.29.2+k3s1        |
+-----------------+-------------------+--------------------------+

+-------------+---------------------+
| Deployment  | Version             |
+-------------+---------------------+
| Cilium      | v1.15.6, v1.16.1    |
| sveltosctl  | v0.37.0             |
+-------------+---------------------+
Prerequisites
To follow along, ensure the below are satisfied.
- A management cluster with Sveltos installed
- kubectl installed
- sveltosctl installed
If you are unaware of installing Sveltos in a Kubernetes cluster, follow the instructions mentioned here.
Step 1: Register Clusters with Sveltos
For this demo, two Civo Kubernetes clusters are used. Once the clusters are ready, we can proceed with the Sveltos cluster registration. To do that, we will utilise sveltosctl. The sveltosctl can be downloaded here.
$ sveltosctl register cluster --namespace=<namespace> --cluster=<cluster name> \
--kubeconfig=<path to Sveltos file with Kubeconfig> \
--labels=key1=value1,key2=value2
Example Registration
$ sveltosctl register cluster --namespace=civo --cluster=mesh01 \
    --kubeconfig=/home/test/prod-zone01.yaml \
    --labels=env=prod,tier=zone01
We will register the clusters with Sveltos on the mentioned namespace, and name, and will attach the cluster labels to perform different deployment versions.
If the namespace does not exist in the management cluster, the command will fail with the namespace not found error. Ensure the defined namespace exists in the cluster before registration.
Validation
$ export KUBECONFIG=<Sveltos managament cluster>

$ kubectl get sveltoscluster -A --show-labels
NAMESPACE   NAME          READY   VERSION          LABELS
mgmt        mgmt          true    v1.28.9+rke2r1   projectsveltos.io/k8s-version=v1.28.9,sveltos-agent=present
prod        prod-zone01   true    v1.28.7+k3s1     env=prod,projectsveltos.io/k8s-version=v1.28.7,sveltos-agent=present,tier=zone01
prod        prod-zone02   true    v1.28.7+k3s1     env=prod,projectsveltos.io/k8s-version=v1.28.7,sveltos-agent=present,tier=zone02
Ensure the labels set to the managed clusters are correct. We will use them at a later step.
Step 2: Deploy Cilium and Monitoring Capabilities
As platform administrators, for every managed cluster, we want to have Cilium as our CNI and monitoring capabilities with Grafana, Prometheus and Loki. For that, we will use the Sveltos ClusterProfile Kubernetes resource and deploy the required deployments in clusters with the label set to env:prod.
ClusterProfile - Cilium, Grafana, Prometheus
---
apiVersion: config.projectsveltos.io/v1beta1
kind: ClusterProfile
metadata:
  name: cluster-prod-initial-setup
spec:
  clusterSelector:
    matchLabels:
      env: prod
  continueOnConflict: true
  helmCharts:
  - chartName: cilium/cilium
    chartVersion: 1.15.6
    helmChartAction: Install
    releaseName: cilium
    releaseNamespace: kube-system
    repositoryName: cilium
    repositoryURL: https://helm.cilium.io/
  - chartName: prometheus-community/kube-prometheus-stack
    chartVersion: v60.2.0
    helmChartAction: Install
    releaseName: prometheus-community
    releaseNamespace: monitoring
    repositoryName: prometheus-community
    repositoryURL: https://prometheus-community.github.io/helm-charts
    values: |
      grafana:
        service:
          type: LoadBalancer
      prometheus-node-exporter:
        service:
          port: 9200
          targetPort: 9200
  validateHealths:
  - name: deployment-health
    featureID: Helm
    group: "apps"
    version: "v1"
    kind: "Deployment"
    namespace: monitoring
    script: |
      function evaluate()
        local hs = {healthy = false, message = "Available replicas not match requested replicas"}
        if obj.status and obj.status.availableReplicas ~= nil and obj.status.availableReplicas == obj.spec.replicas then
          hs.healthy = true
        end
        return hs
      end
We instruct Sveltos firstly to install Cilium as our CNI. Next, we deploy the Grafana and Prometheus stack and ensure the second deployment is in a healthy state using the validateHealths. Afterwards, we proceed with the Loki integration.
ClusterProfile - Loki
---
apiVersion: config.projectsveltos.io/v1beta1
kind: ClusterProfile
metadata:
  name: loki-2102-prod
spec:
  dependsOn:
  - cluster-prod-initial-setup
  clusterSelector:
    matchLabels:
      env: prod
  continueOnConflict: true
  helmCharts:
  - repositoryURL: https://grafana.github.io/helm-charts
    repositoryName: grafana
    chartName: grafana/loki-stack
    chartVersion: v2.10.2
    releaseName: loki
    releaseNamespace: loki-stack
    helmChartAction: Install
Ensure the dependsOn contains the correct name definition. In our example, it iscluster-prod-initial-setup.
Deploy ClusterProfiles - Management Cluster
$ export KUBECONFIG=<Sveltos managament cluster>

$ kubectl apply -f clusterprofile_prod_setup.yaml,clusterprofile_loki.yaml
Validation - Management Cluster
$ ./sveltosctl show addons
+------------------+---------------+-------------+----------------------+---------+--------------------------------+-------------------------------------------+
|     CLUSTER      | RESOURCE TYPE |  NAMESPACE  |         NAME         | VERSION |              TIME              |                 PROFILES                  |
+------------------+---------------+-------------+----------------------+---------+--------------------------------+-------------------------------------------+
| prod/prod-zone01 | helm chart    | kube-system | cilium               | 1.15.6  | 2024-09-23 12:18:37 +0200 CEST | ClusterProfile/cluster-prod-initial-setup |
| prod/prod-zone01 | helm chart    | monitoring  | prometheus-community | 60.2.0  | 2024-09-23 12:18:47 +0200 CEST | ClusterProfile/cluster-prod-initial-setup |
| prod/prod-zone01 | helm chart    | loki-stack  | loki                 | 2.10.2  | 2024-09-23 12:20:38 +0200 CEST | ClusterProfile/loki-2102-prod             |
| prod/prod-zone02 | helm chart    | kube-system | cilium               | 1.15.6  | 2024-09-23 12:18:47 +0200 CEST | ClusterProfile/cluster-prod-initial-setup |
| prod/prod-zone02 | helm chart    | monitoring  | prometheus-community | 60.2.0  | 2024-09-23 12:18:56 +0200 CEST | ClusterProfile/cluster-prod-initial-setup |
| prod/prod-zone02 | helm chart    | loki-stack  | loki                 | 2.10.2  | 2024-09-23 12:20:47 +0200 CEST | ClusterProfile/loki-2102-prod             |
+------------------+---------------+-------------+----------------------+---------+--------------------------------+-------------------------------------------+
Validation - Managed Cluster
$ kubectl get pods -n kube-system | grep -i cilium
cilium-operator-579c6c96c4-47wsk   1/1     Running   0          10m
cilium-operator-579c6c96c4-djk8s   1/1     Running   0          10m
cilium-mwk7x                       1/1     Running   0          10m
cilium-x5z5v                       1/1     Running   0          10m

$ kubectl get ds/cilium -n kube-system -o jsonpath='{.spec.template.spec.containers[0].image}'
quay.io/cilium/cilium:v1.15.6@sha256:6aa840986a3a9722cd967ef63248d675a87add7e1704740902d5d3162f0c0def

$ kubectl get pods -n monitoring
NAME                                                       READY   STATUS    RESTARTS   AGE
prometheus-community-prometheus-node-exporter-78llc        1/1     Running   0          11m
prometheus-community-prometheus-node-exporter-xhcf9        1/1     Running   0          11m
prometheus-community-kube-operator-5746cfbb9-4p45x         1/1     Running   0          11m
prometheus-community-kube-state-metrics-7fc779fc58-z4ktb   1/1     Running   0          11m
alertmanager-prometheus-community-kube-alertmanager-0      2/2     Running   0          11m
prometheus-prometheus-community-kube-prometheus-0          2/2     Running   0          11m
prometheus-community-grafana-7494f9df89-pjqdd              3/3     Running   0          11m

$ kubectl get pods -n loki-stack
NAME                  READY   STATUS    RESTARTS   AGE
loki-promtail-ttdgx   1/1     Running   0          10m
loki-promtail-jq5td   1/1     Running   0          10m
loki-0                1/1     Running   0          10m
We installed Cilium, Grafana, Prometheus and Loki in our production clusters. Awesome! 🎉 Now, we will continue with the update of Cilium on a subnet of clusters only.
Step 3: Update Cilium tier:zone02 Cluster
As mentioned, we would like to use the Sveltos tier feature to update Cilium only on the clusters with the label set to tier:zone02. The matching cluster in our example will be the prod-zone01 cluster.
Issue: Because we have a ClusterProfile that installed Cilium to the cluster prod-zone01, how can we instruct Sveltos to update this cluster and only the Cilium deployment?
To achieve this, we will create a new ClusterProfile with the user of tier. We will instruct Sveltos to take the new ClusterProfile with a lower tier value set and update Cilium CNI only on the matching clusters.
The default tier value for every ClusterProfile/Profile is set to 100. If you set this to a lower value, Sveltos will take the lower value as a higher priority deployment.
ClusterProfile - Update Cilium
---
apiVersion: config.projectsveltos.io/v1beta1
kind: ClusterProfile
metadata:
  name: cilium-1161
spec:
  tier: 50
  clusterSelector:
    matchLabels:
      tier: zone02
  continueOnConflict: true
  helmCharts:
  - chartName: cilium/cilium
    chartVersion: 1.16.1
    helmChartAction: Install
    releaseName: cilium
    releaseNamespace: kube-system
    repositoryName: cilium
    repositoryURL: https://helm.cilium.io/
Validation - Management Cluster
$ ./sveltosctl show addons --cluster=prod-zone02
+------------------+---------------+-------------+----------------------+---------+--------------------------------+-------------------------------------------+
|     CLUSTER      | RESOURCE TYPE |  NAMESPACE  |         NAME         | VERSION |              TIME              |                 PROFILES                  |
+------------------+---------------+-------------+----------------------+---------+--------------------------------+-------------------------------------------+
| prod/prod-zone02 | helm chart    | monitoring  | prometheus-community | 60.2.0  | 2024-09-23 12:18:56 +0200 CEST | ClusterProfile/cluster-prod-initial-setup |
| prod/prod-zone02 | helm chart    | loki-stack  | loki                 | 2.10.2  | 2024-09-23 12:20:47 +0200 CEST | ClusterProfile/loki-2102-prod             |
| prod/prod-zone02 | helm chart    | kube-system | cilium               | 1.16.1  | 2024-09-23 12:32:27 +0200 CEST | ClusterProfile/cilium-1161                |
+------------------+---------------+-------------+----------------------+---------+--------------------------------+-------------------------------------------+
Validation - Managed Cluster
$ kubectl get pods -n kube-system | grep -i cilium
cilium-operator-66dcfc4678-76j6m   1/1     Running   0          2m44s
cilium-operator-66dcfc4678-6wvbr   1/1     Running   0          2m44s
cilium-xnt7k                       1/1     Running   0          2m44s
cilium-envoy-rj8pj                 1/1     Running   0          2m45s
cilium-8fbzc                       1/1     Running   0          2m44s
cilium-envoy-hkhmc                 1/1     Running   0          2m45s

$ kubectl get ds/cilium -n kube-system -o jsonpath='{.spec.template.spec.containers[0].image}'
quay.io/cilium/cilium:v1.16.1@sha256:0b4a3ab41a4760d86b7fc945b8783747ba27f29dac30dd434d94f2c9e3679f39
Sveltos Tiers Benefits
Sveltos tiers allow seamless targeting 🎯 and updating 🔄 of different Kubernetes applications and add-ons in a subset of clusters. Now, we have a way to perform updates without headaches 😌 and be confident and full of control 🛠️ using the GitOps approach.
Conclusions
In a few minutes ⏳, with minimal configuration effort and following the GitOps approach, we updated Cilium CNI in a subset of clusters painless! 🎉 Find more about the Sveltos tiers here.
✉️ Contact
We are here to help! Whether you have questions, or issues or need assistance, our Slack channel is the perfect place for you. Click here to join us us.
👏 Support this project
Every contribution counts! If you enjoyed this article, check out the Projectsveltos GitHub repo. You can star 🌟 the project if you find it helpful.
The GitHub repo is a great resource for getting started with the project. It contains the code, documentation, and many more examples.
Thanks for reading!